An Update on the Community Bank Landscape: Where Are They Now?
A two-year follow-up to Secrets to Survival in Community Banking
What the Original Data Told Us
Two years ago, we published a study of 230 community banks with assets between $3 billion and $20 billion, covering the period from 2019 to 2023. We divided those banks into four performance quadrants based on two dimensions: asset growth and return on equity. That produced 66 Winners (high growth, high ROE), 60 Laggards (low growth, low ROE), and two intermediate groups.
Three factors typically thought to drive success turned out to be essentially irrelevant: bank size, opportunistic acquisitions, and regional market growth. The high performers were actually slightly smaller than the laggards and had fewer participants in the acquisition market than laggards. Regional GDP growth was nearly identical across both groups.
Two factors did predict success. First, efficiency: Winners ran a median efficiency ratio of 55%, versus 65% for Laggards, and they directed a higher share of their expense base toward personnel, suggesting a deliberate over-investment in talent. Second, MSA concentration: Winners grew their metropolitan-area deposits more than 50% faster than Laggards. The losing banks were spread too thin across sub-scale markets, draining resources from the places that actually mattered.
A third finding cut across both: strategic commitment. Banks that made three or more acquisitions were 4.5 times more likely to be Winners than Laggards. And banks whose deposit base was less than 45% FDIC-insured, signaling a focus on larger commercial and affluent customers, were 70% more likely to be Winners. The banks that chose a lane and committed to it were the ones that pulled ahead.
That was the picture through the end of 2023. The question now is: where are those same banks two years later?
A Changed Environment
The 2024 to 2025 period rewarded what original Winners were already doing and punished those who were not. Two major forces defined the shift.
Interest Rates: From Tailwind to Headwind
The federal funds rate averaged approximately 1.9% from 2019 to 2023, rising to approximately 4.7% across 2024 and 2025. Early rate increases actually lifted margins as asset yields repriced faster than deposit costs. That reversed in two stages: by late 2023 into 2024, deposit costs caught up to peak rates while asset yields plateaued, squeezing margins from the funding side. Once the Fed began easing in September 2024, asset yields fell faster than deposit costs could adjust, compounding the pressure, while high-yield savings accounts and online competitors kept intensifying deposit competition. Banks with sticky, low-cost deposit bases absorbed the pressure. Those without them felt it acutely.
AI: A Widening Competitive Gap
By 2024 to 2025, larger banks were deploying artificial intelligence at scale across customer service, credit underwriting, and back-office operations. Meanwhile, most community and mid-size banks are still in early stages of experimentation.
Taken together, these forces created a squeeze that rewarded the Winner profile from the original study: low efficiency ratios, sticky MSA-based deposit franchises, and a focus on affluent and commercial customers. The environment raised the stakes.
What the New Data Shows
Returning to the original 230-bank sample, two things stand out at the aggregate level. The median ROE across the sample remained at 10%, and the median asset growth CAGR for 2023 to 2025 has compressed to 4%, down from 10% in the last study.
Movement Within the Grid: Where Original Winners Are Now
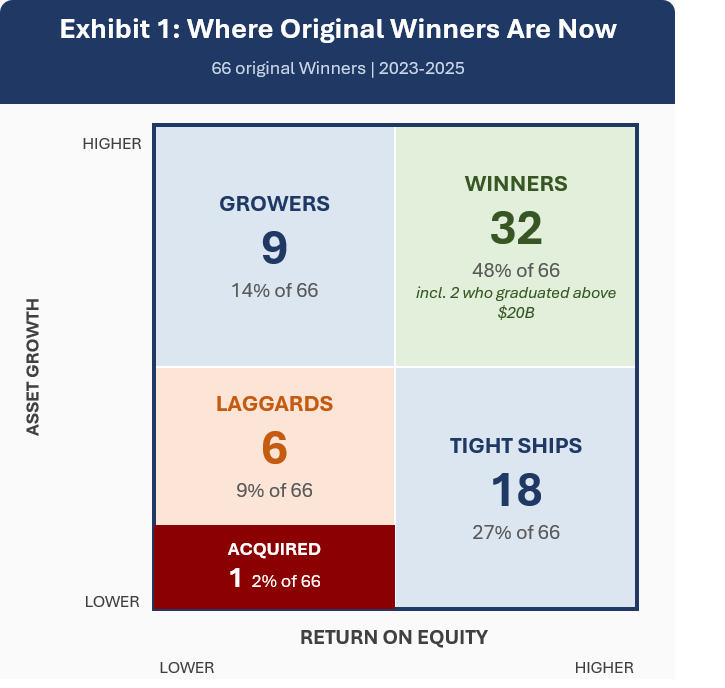
Roughly half of original Winners, 48%, maintained their status. The most common destination for Winners who lost ground was the Low Growth/High ROE quadrant (27%), suggesting many managed to protect their returns even as asset growth slowed. Still, 23% of original Winners either fell to Laggard status or sacrificed returns for growth. The message is clear: a winning position is not self-sustaining.
Movement Within the Grid: Where Original Laggards Are Now
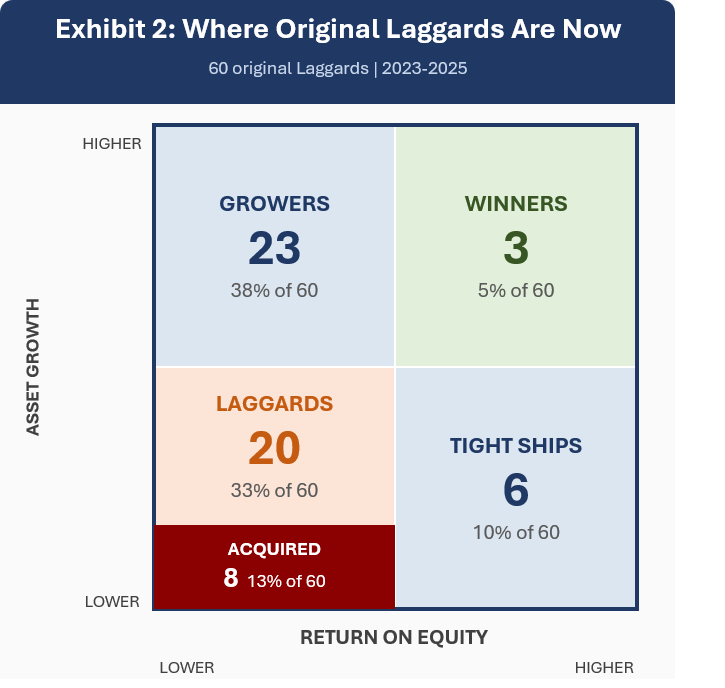
46% of original Laggards stayed either stuck in the bottom quadrant or ceased to exist. 13% were acquired outright, the highest acquisition rate of any quadrant. The direction of travel reveals the underlying challenge: only 15% of Laggards were able to improve their returns above median. Only 5% became true Winners.
M&A Activity: The Odds of Getting Acquired
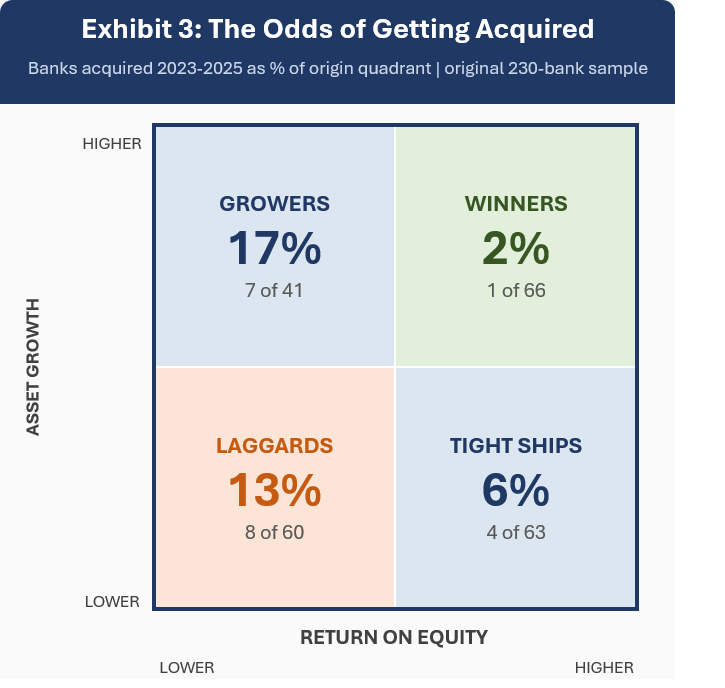
From the original 230 banks in the sample, 20 were acquired in the last 2 years. The odds of getting acquired were dramatically higher for a lagging bank than a leading bank, with 13% of Laggards acquired and just 2% of Winners. Notably, 75% of the banks acquired had below median ROE. So, the key to staying independent starts with maintaining disciplined returns.
Three institutions in the original sample grew rapidly enough to exit above the $20 billion upper bound. Two did so through major acquisitions completed: Provident Bank, which merged with Lakeland Bancorp to create a $24.5 billion franchise, and Renasant Bank, which completed its $1.2 billion acquisition of The First Bancshares.
Key Takeaways
The data across both periods points to a set of conclusions that have only sharpened with two more years of evidence.
- The environment raised the stakes, not the rules. The 2024 to 2025 macro backdrop did not change what it takes to win. It made the cost of not winning higher. Banks that had already built the right foundation absorbed the squeeze. Those that had not were exposed.
- Holding a winning position requires as much discipline as earning it. Half of original Winners experienced at least some degradation over two years. In a tough environment, protecting returns even at the cost of growth is the right move. Chasing volume that does not return well is how Winners become Laggards.
- Difficult to change trajectory on ROE. Most of the Laggards remained in a challenging return situation. Those that shifted their position were predominantly shifting into the High Growth/Low ROE box. Growth without returns is not a path to winning. It is a path to being acquired.
- The exit is not random. Acquisition activity skews overwhelmingly toward low-ROE institutions. Returns discipline is not just a performance strategy. It is the most reliable way to remain an independent institution.
Copyright © 2026 CustomStrat Advisory, Amquant. All rights reserved.
Related Articles
Strategy in the Age of AI: A Community and Mid-Size Bank Perspective
The same strategic questions—where, how, and when to compete—carry higher stakes for community and mid-size banks in the age of AI.
Three Simple Strategy Tests Every Leadership Team Should Apply
How to ensure your strategy is grounded in customer choice, economic logic, and real commitment. Three questions every leadership team should answer with confidence.
Secrets to Survival in Community Banking
What is and is NOT correlated to Success